One of the project which involved me building pipelines and was somewhat applied ml was this project. Back in my third year, a few friends and I put together SoccArt; an end-to-end computer vision pipeline that takes raw broadcast footage of a soccer match and turns it into structured, analyzable data: player and ball positions, team assignments, jersey numbers, and a top-down minimap of the game.
What made this project memorable was that it got picked up beyond just a course submission. We were invited by Prof. Deepak Subramani to present it as a poster, and it ended up going to the 1st Conference on Applied AI and Scientific Machine Learning (CASML 2024), held from 16th-18th December 2024, under the title "State of the Art Soccer Analysis Pipeline using Artificial Intelligence." It was a great excuse to take something that started as a hacky course project and push it to a level where it could hold up in front of a room full of people asking hard questions about it.
Motivation
A lot of us on the team just enjoy watching football, and like most fans we wanted to keep track of scores and maybe get a bit predictive about it; using past data to reason about how a team or player is likely to perform. Doing that properly means keeping information about every player up to date: where they played on the pitch, how many goals they scored, how their game evolved over a season. You can maintain all of that by hand, but it becomes a lot easier if you can just point a model at existing match footage and have it keep track of everyone for you.
This line of thinking is what pushed us toward wanting a top-down view of the game rather than just annotating the broadcast feed. Watching the broadcast angle, it's genuinely hard to tell how the ball is actually moving between the two teams. A bird's-eye minimap makes that immediately obvious, and that was really the core intuition. If somehow we can manage to get bird's eye view of the game, we can use that map to keep track of player's position in the ground or track any sensible information. So the technical bet became: if we could track the jersey number, the player, and the ball closely enough to reconstruct an equivalent top-down view of the match, a lot of interesting statistics would start to fall out almost for free.
That was more or less the motivation that led us to propose this as a course project. I quite enjoyed working on it back then.
What the pipeline actually does
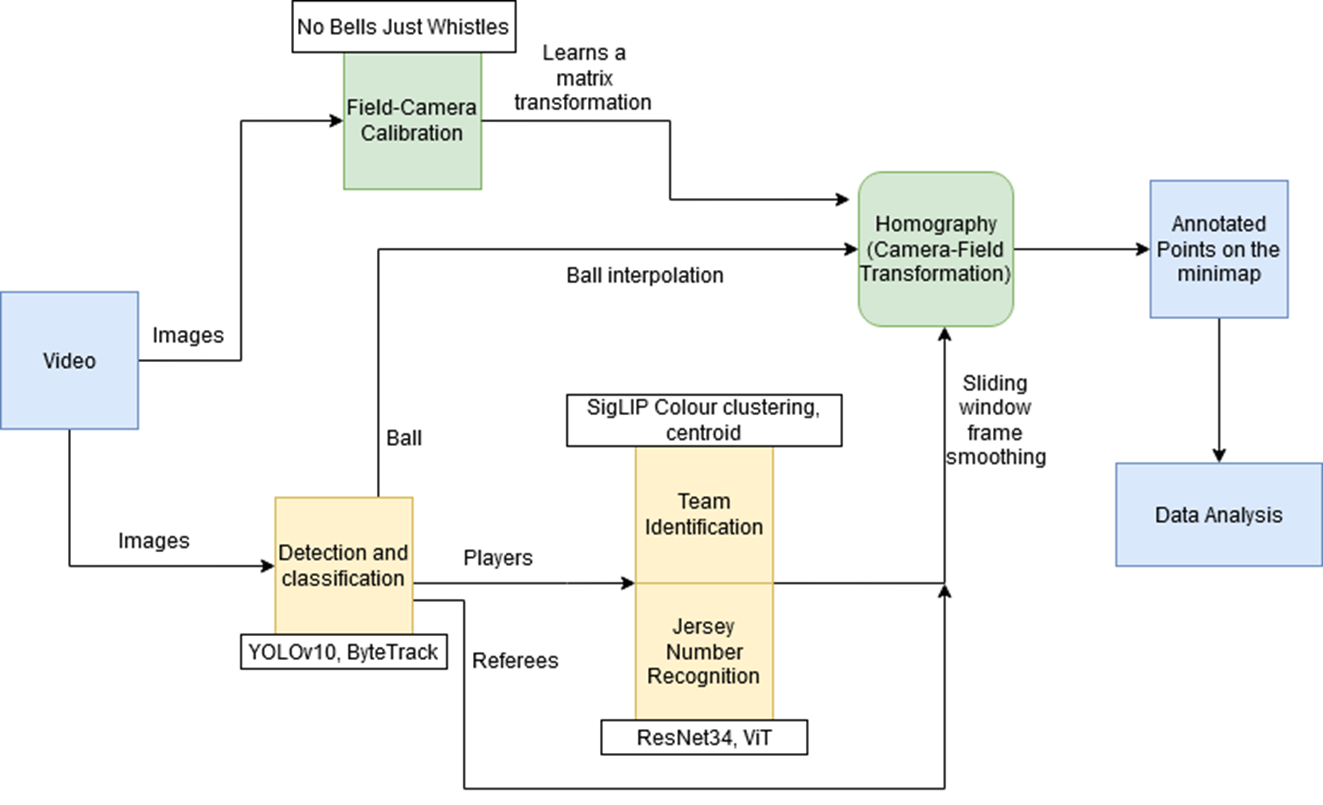
The system is built around a few stages, each of which was its own rabbit hole of tuning and engineering:
- Detection & tracking: YOLOv10 for detecting players, referees, and the ball, combined with ByteTrack to keep consistent identities across frames.
- Team identification & jersey recognition: SigLIP-based color clustering to split players into teams, plus ResNet34 and ViTPose-based models to read jersey numbers off moving players.
- Field calibration: homography estimation to calibrate the broadcast camera against the pitch and project every detection onto a 2D minimap.
- Temporal smoothing: interpolation with sliding-window smoothing so tracks don't jitter frame to frame, which matters a lot once you start computing things like distance covered or passing lanes.
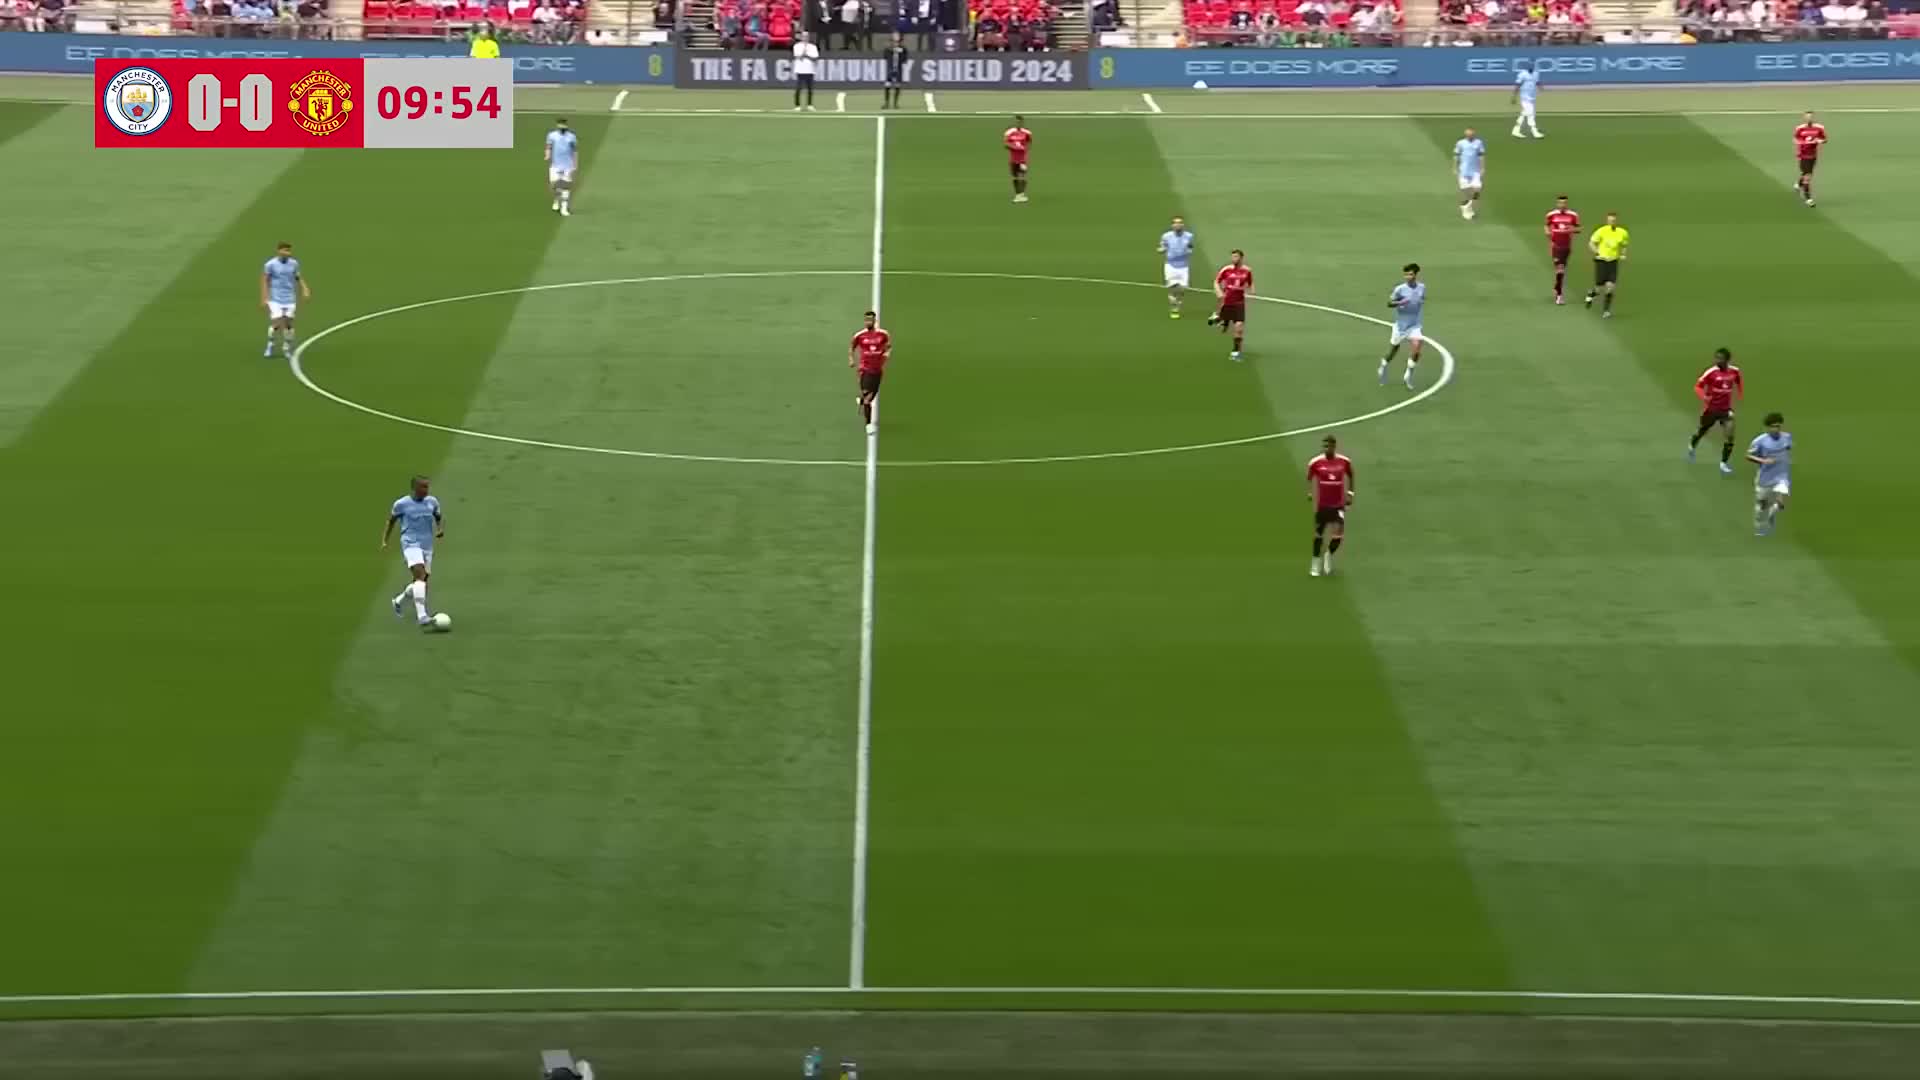
Here's the pipeline running on an actual clip — raw frame, detections with tracking IDs, and the resulting minimap:
Video can be broken down into frames, and each frame can be processed to detect players, referees, and the ball. The idea is to parallely calibrate the potential position of the camera relative to the pitch, and detect the object of interests in the frame.
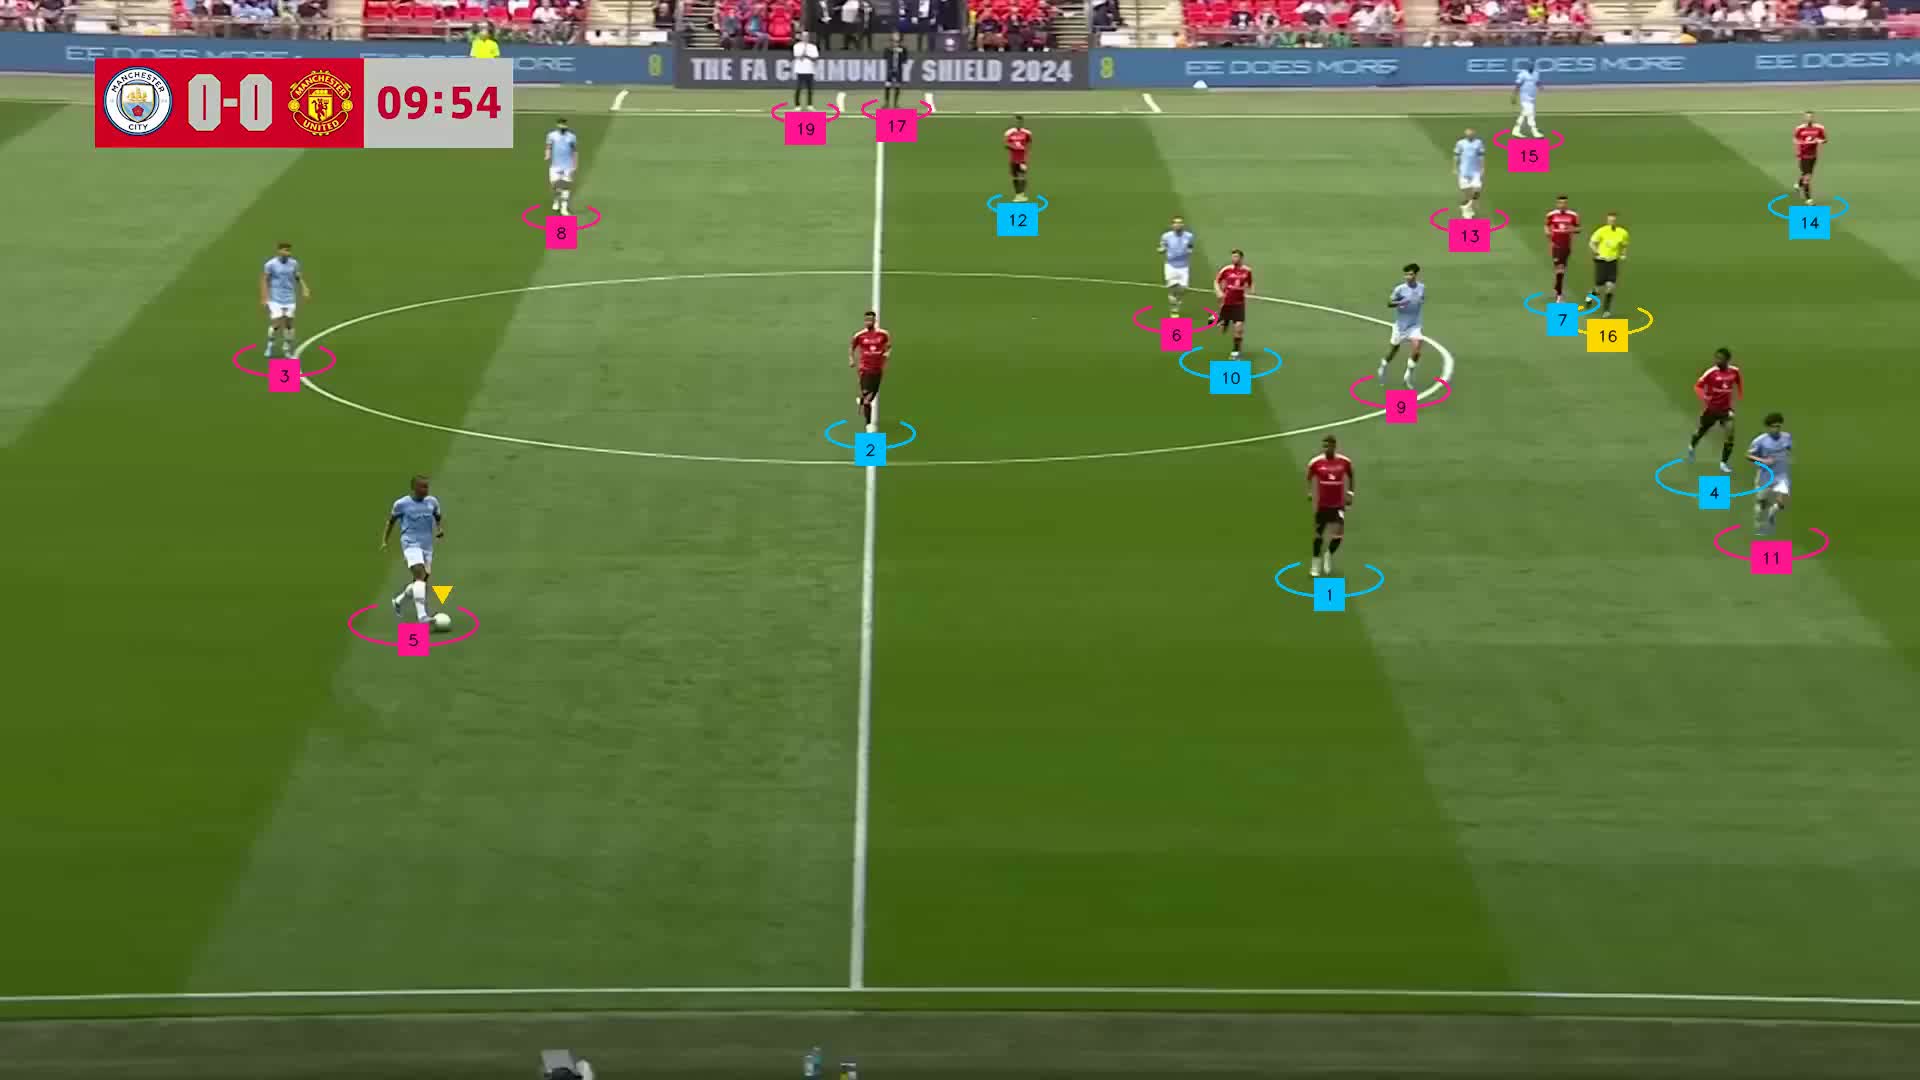
Once the object of interests are detected, the next step is to project the detected objects onto a top-down view of the pitch. This is done by estimating the homography between the broadcast camera and the pitch, allowing us to map each detection to its corresponding (potential) position on the minimap. During this stage, we also assign each player to a team and read their jersey numbers, which is crucial for tracking individual players across frames. The speed at which one may be able to construct such map is a function of the inference process. I believe this was my first project where inference was a bottleneck, in particular the jersey number recognition stage. The inference time for this stage was quite high.
During the time of the project, I was not yet aware of the techniques in model compression and quantization, which could have been used to speed up the inference process. We had limited time and we were just running on coffee and energy drinks during that time of the semester. This did not allow us to think about the inference time and how to optimize it. We were more focused on getting the pipeline to work end-to-end, and we were able to achieve that. The inference time was not a major concern for us at that time. However, I believe that with the current state of model compression and quantization techniques, we could have significantly reduced the inference time for the jersey number recognition stage.
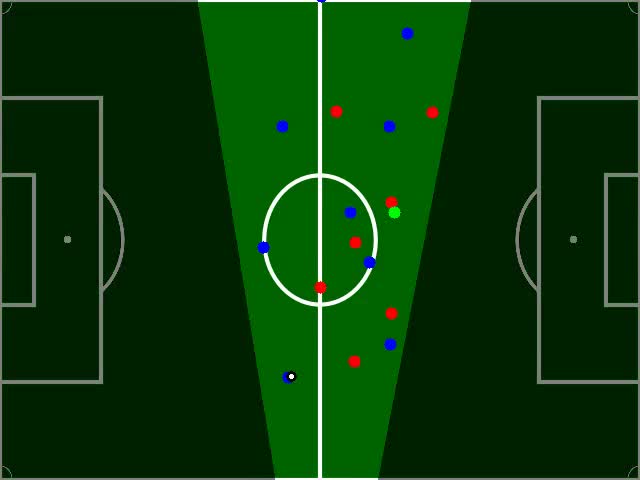
When a frame is processed completely, one may achieve a minimap as above where each team can be repesented by a particular color. The highlighted region is the potential point of view of the camera being used to record the match. This ensures that we have certain intuition about the players within the region and time frames where the statistics around the player can be trusted.
Here's the tracking demo video from the repo:
The demo video shows the pipeline in action and the resulting minimap after the video is processed. This minimap can be used to compute various statistics about the game, such as player positions, ball possession, and passing lanes. The minimap can also be used to visualize the game in a more intuitive way, allowing coaches and analysts to make better decisions based on the data. Few examples of such analysis are included in our GitHub repo.
Team
This was very much a group effort with Aditya Gupta, Armaan Khetarpaul, R. K. Shishir, S. Sharath, and Umang Majumder; each of us owned a different stage of the pipeline, from detection and tracking to calibration and jersey recognition, and the poster was really a synthesis of all of it.
Code, the trained weights, the full poster, and the abstract are all up on the GitHub repo if you want to dig into the implementation.